Forum Discussion
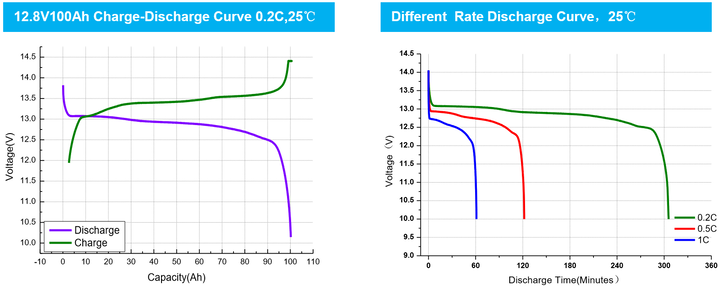
 3_tonsExplorer IIIThe discharge chart ‘kinda hints’ at why actual LFP experience departs from more conventional battery types - notice the voltage at a uber low 90+% DOD (depth of discharge) - yet (presumably…) still no low voltage alarm…When using an inverter, this aspect (accompanied by LFP’s low voltage sag ‘under a load’ - e.g. no struggling during air cond starts) somewhat mimics shore power experience, thus ideal for appliance loads and such…
However when considering this *chart’s plot, it might also be worth noting that a battery’s actual ‘real-world’ capacity (as determined via bench load test) can often be slightly greater than the Mfg’s rated capacity - per my own load test, a 7% greater capacity result than the mfg’s advertised rating…
*(chart’s 90% of what??…)
In view of this ‘potential overage’, using the abstract example of say a 100a/h battery, 90% DOD might not occur until about the 96 consumed a/h mark, or (if put differently…), upon arrival of say a metered ‘100a/h consumed’ mark (per Victron BMV 712, battery bluetooth or equiv.), a possible 7a/h (+ or - ??…) remaining overage, likely having experienced no low voltage alarms…
Disclaimer: I’m not suggesting this sorta capacity overage is the case for all Mfg’s batteries, nor that such deep DOD excursions be done ‘as a matter of the routine’ - User experience only here, just something to ponder…
3 tons Itinerant1ExplorerUnless you're pulling a heavy load at a lower SOC the voltage sag isn't that big of a deal. Yesterday using the microwave and toaster the battery display showed 180a draw 12.96v (inverter display showing 12.7v), after both loads done 13.15v on battery display. I forget the exact SOC but somewhere around 65%.
- pianotunaNomad III
BurbMan wrote:
Any way to make that chart bigger or post a link to it?
Hi BurbMan,
I'm sorry--I did not think to post the link. It took rather a lot of time to find it. Here is a link: https://www.custommarineproducts.com/uploads/1/4/3/7/1437708/published/lifepo4-discharge-curves_9.png
Right click it, then open in new tab, then enlarge it. - pianotunaNomad III
jaycocreek wrote:
It would be interesting to see the difference between different loads and the sag that goes with it..I have looked and looked and can't seem to find the average or exceptable sag with loads applied...I do see some tell others that's too much sag or that's in the ball park,but nothing about what's normal and what isn't...
That is what the left graph shows. It is quite useful as it speaks in "C". The smallest load is 0.2 c, middle of road is 0.5 c, and the "push it hard" is 1 C. If it is a 100 amp-hour battery, then the lightest load (green) is 20 amps; middle is 50 amps; and the high draw one is 100 amps.  CA_TravelerExplorer III
BurbMan wrote:
Copy it and increase the image size.
Any way to make that chart bigger or post a link to it?- CA_TravelerExplorer IIII'd argue that wiring is more important for flooded batteries due to their significant voltage drop for discharge vs lithium. This results in lower voltage to the devices for flooded batteries.
 BurbManExplorer IIAny way to make that chart bigger or post a link to it?
 BFL13Explorer IIRight! It is what it is, so allow for that so you can recharge the bank tomorrow instead of today, or if needed, do it today so you can go up to the lake for a swim tomorrow. Whatever works for camping priorities!
 jaycocreekExplorer II
Never mind the type of battery. You will never see "what's normal" because a large part of it is the R from wiring and connections and not just to do with the batteries themselves as such.
So first do what you can with your own rig besides the battery choice.
There are a few questions that keep coming up about lifepo4 that appears not to have a definite answer..As you pointed out,the first questions to a poster asking about sag are wiring/connections etc..Assuming that all is in spec,then there is still know real answer..
Of course I would expect a difference in 5-10 amp draw vrs 85-100 amps of a microwave..It just seems there would be some kind of formula/chart that's in the ball park maybe..
I found one chart that list no load/load for different voltages but know mention of load rating..
I'm good with my battery type and connections,just trying to learn as much as possible about LFP,not that it really matters to me other than curiosity..As my Lynx battery tech said..In the end it's just a battery..Enjoy it..LOL- BFL13Explorer II
jaycocreek wrote:
It would be interesting to see the difference between different loads and the sag that goes with it..I have looked and looked and can't seem to find the average or exceptable sag with loads applied...I do see some tell others that's too much sag or that's in the ball park,but nothing about what's normal and what isn't...
Never mind the type of battery. You will never see "what's normal" because a large part of it is the R from wiring and connections and not just to do with the batteries themselves as such.
So first do what you can with your own rig besides the battery choice.
About Technical Issues
Having RV issues? Connect with others who have been in your shoes.24,201 PostsLatest Activity: Feb 19, 2025