Forum Discussion
KendallP
Mar 10, 2022Explorer
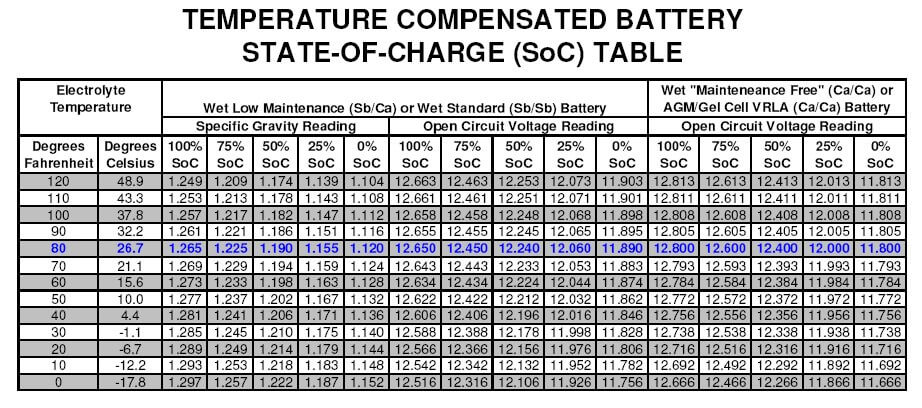
Here's the chart. I have the excel file for it. It's quite involved. Someone put some serious time into it. Don't recall where I came across it, but it's credited to bb_94401, a forum member who hasn't posted in quite a few years.
Pianotuna posted the excel file on another forum here.
The chart places a 0.040 difference between 75 and 100%. It didn't take Trig to come up with my estimated SOC differential of approximately 15%. Assuming, of course... that the chart is accurate.
One could run his own experiments by cross referencing resting voltages with SG readings.
About Technical Issues
Having RV issues? Connect with others who have been in your shoes.24,393 PostsLatest Activity: Jun 12, 2026