Forum Discussion
NewsW
Jul 19, 2012Explorer
From Niner link:
Not terribly surprising.
Need to do two sorts here.
One is to sort the temperature band of the high failure rate states vs. the low failure rates.
Now, the problem is, the lower temperature states are also the ones with more biodiesel mandates.
Get a stats guy here, but it looks like there are two phenomena... and some quick and dirty number crunching will yield an estimate of what factor has the more explanatory power:
- is it the incremental increase in lubricity from biodiesel?
OR
- temperature?
I am a tad uneasy about biodiesel increasing lubricity as I know one way blenders work is to lower the additives to improve lubricity if biodiesel is blended --- as long as the spec is met, what they put in to get it is beside the point.
Thus, one cannot conclusively say that biodiesel blends have higher lubricity in the field.
What about sorting it by PADD?
http://www.eia.gov/electricity/regionsmap/fedregstates.html
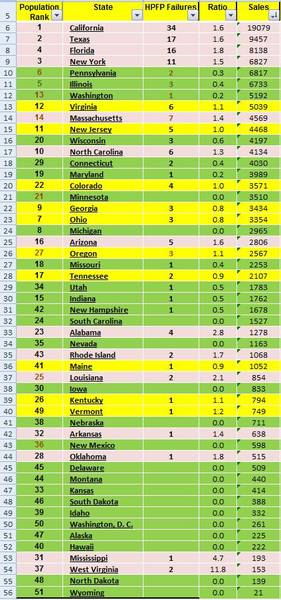
I took dweisel's state failure list and did some analysis based on sales data provided by VW to NHTSA. I wanted to see what the data looked like if I computed the failures ratio based on sales ratio data by state. Of course we know that state sales data will not correspond to where the owners may actually reside and the state sales ratios may be different now as the sales data is almost 1 1/2 years old. But for states with large sales, a variance in the data will not affect the results very much. The table below shows the actual data. The ratio column indicates the (% of failures) / (% of sales) for that state. I have also colored coded the ratio data: pink > 1.2 ratio, green < 0.8, and 1.2 >= yellow >= 0.8
When looking at the data, one should also be aware that one failure in a state with a small % of the total sales of about 139k, can affect the ratio significantly. So, I'd ignore the ratio in any state with less than around 4000 sales. But for the states above 5000 sales, I'd say one can make inferences from the data. So why do some states above 5000 in sales have such a wide range in the ratio. Could it be related to the lubricity of the fuel? When looking at the data above 5000 sales, there seems to be a significantly less likelihood of HPFP failure in states that have a bio mandate or where bio is widely available (PA, IL, WA). The ratio for the pink / yellow states is in the 1.1 - 1.8 range while the green states are in the 0.2 - 0.4 range. Is this evidence that increasing lubricity to say a 300 micron wear scar level with the additon of at least B2 results in a lower HPFP failure rate by a factor of maybe 3-5 times? You can look at the data and draw your own conclusion.
Not terribly surprising.
Need to do two sorts here.
One is to sort the temperature band of the high failure rate states vs. the low failure rates.
Now, the problem is, the lower temperature states are also the ones with more biodiesel mandates.
Get a stats guy here, but it looks like there are two phenomena... and some quick and dirty number crunching will yield an estimate of what factor has the more explanatory power:
- is it the incremental increase in lubricity from biodiesel?
OR
- temperature?
I am a tad uneasy about biodiesel increasing lubricity as I know one way blenders work is to lower the additives to improve lubricity if biodiesel is blended --- as long as the spec is met, what they put in to get it is beside the point.
Thus, one cannot conclusively say that biodiesel blends have higher lubricity in the field.
What about sorting it by PADD?
PADD: Petroleum Administration for Defense Districts
PAD District 1 (East Coast) is composed of the following three subdistricts:
Subdistrict 1A (New England): Connecticut, Maine, Massachusetts, New Hampshire, Rhode Island, Vermont.
Subdistrict 1B (Central Atlantic): Delaware, District of Columbia, Maryland, New Jersey, New York, Pennsylvania.
Subdistrict 1C (Lower Atlantic): Florida, Georgia, North Carolina, South Carolina, Virginia, West Virginia.
PAD District 2 (Midwest): Illinois, Indiana, Iowa, Kansas, Kentucky, Michigan, Minnesota, Missouri, Nebraska, North Dakota, South Dakota, Ohio, Oklahoma, Tennessee, Wisconsin.
PAD District 3 (Gulf Coast): Alabama, Arkansas, Louisiana, Mississippi, New Mexico, Texas.
PAD District 4 (Rocky Mountain): Colorado, Idaho, Montana, Utah, Wyoming.
PAD District 5 (West Coast): Alaska, Arizona, California, Hawaii, Nevada, Oregon, Washington.
http://www.eia.gov/electricity/regionsmap/fedregstates.html
About Around The Campfire
44 PostsLatest Activity: Mar 27, 2026