NinerBikes
Feb 27, 2016Explorer
Going Lithium batteries? Charging profile revealed.
A few months back I bought an electric car, as well as an EVSE to recharge it at home. I ended up buying a e-motorwerks JuiceBox 40Amp unit with an Arduino chip in it for monitoring charging specifications.
Some back round... my car is a 2015 VW e-Golf. It has a 24.2 kw traction battery. Only 21.1 kw is useable, to protect from overcharging and undercharging, both hard on battery life. I did go with the 7.2kwh charger on board, as well as DC fast charge plug, which goes into a DC charge machine capable of 50 kwh at 300- 480Volts, capable of 20 to 30 minute charging at 80 and 90% respectively... again that last 10% when cramming in the electrons fast is problematic, it generates heat, and heat is bad for the Li ion cells.
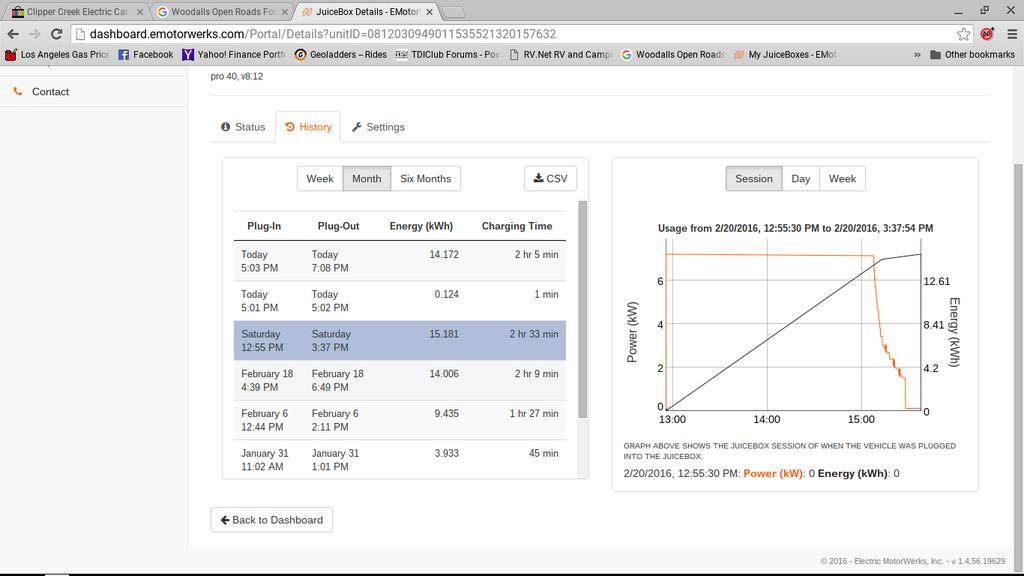
What I believe might be of interest is the charging curve shown as logged by the Arduino unit and software that come with the Juice Box 40 Pro, because it will relate to how Lithium batteries recharge in an RV environment. So here's the graph.

Input is 242V to 239V during charging, amperage is 30 amps. The last 20 minutes of charging is lucky to add 1 kw of electricity to the charge controller. The rest of the time, it's adding at 7.2 kw to the charge controller.
What this means, to you, the RV owner is that absorption charging time is highly minimized. Most all of your time can be spent bulk charging quickly, if you have the amperage capacity to do so.
If someone can advise me on how to pull down that CSV file ( I assume it's raw data), I'd be glad to post it up.
Some back round... my car is a 2015 VW e-Golf. It has a 24.2 kw traction battery. Only 21.1 kw is useable, to protect from overcharging and undercharging, both hard on battery life. I did go with the 7.2kwh charger on board, as well as DC fast charge plug, which goes into a DC charge machine capable of 50 kwh at 300- 480Volts, capable of 20 to 30 minute charging at 80 and 90% respectively... again that last 10% when cramming in the electrons fast is problematic, it generates heat, and heat is bad for the Li ion cells.
What I believe might be of interest is the charging curve shown as logged by the Arduino unit and software that come with the Juice Box 40 Pro, because it will relate to how Lithium batteries recharge in an RV environment. So here's the graph.

Input is 242V to 239V during charging, amperage is 30 amps. The last 20 minutes of charging is lucky to add 1 kw of electricity to the charge controller. The rest of the time, it's adding at 7.2 kw to the charge controller.
What this means, to you, the RV owner is that absorption charging time is highly minimized. Most all of your time can be spent bulk charging quickly, if you have the amperage capacity to do so.
If someone can advise me on how to pull down that CSV file ( I assume it's raw data), I'd be glad to post it up.